Figure 1: A sketch of the biosensor "EVA 2.0" based on angle interrogation of a PC SM.
The typical reflection profile is shown near the CMOS matrix.
Note that this setup also may be used as a critical-angle refractometer, if only q
TIR angle is measured.
Photonic Crystal Surface Mode (PC SM)-based biosensor "EVA 2.0" is label-free biosensor with
an independent registration
of the critical angle of total internal reflection (TIR) from the liquid.
In Fig. 1 a sketch of the biosensor and typical
signals from the photodiode array are shown.
A laser beam from fiber-coupled diode laser
is sent to the sensor surface
through a polarization-maintaining fiber cable
(to improve the quality of a beam profile).
The beam is focused by a cylindrical lens so that the excitation angle of one s -polarized PC SM (existing in this
1D PC) structure and TIR angle (in p -polarization) are contained in the convergence angle of the beam.
After reflection from the sensor surface, the reflection profile contains information about the TIR angle (transferred by the p -polarized part of the beam) and about the angle of the PC SM excitation (transferred by the s -polarized part of the beam).
Moreover, the sharpness of the reflection near the critical angle, and the measurement precision of the liquid RI herein are much higher than those used in standard critical-angle refractometers on uncoated prisms that enhance the RI sensitivity of the biosensor [1,2].
Such types of PC SM sensors also possess one-dimensional spatial selectivity in a direction perpendicular to the plane of the Figure 1 (i.e., along the focus line of the cylindrical lens).
This fact permits recording of several reactions with an analyte simultaneously if different ligands are deposited on the PC in several linear target bands.
In this way several tests can be performed at once that increases the throughput of the sensor.
Flow cells
The flow cells are made from a glass slide with two or four holes through which
glass tubes are fitted to serve as inlet and outlet, respectively.
The inlet tube is connected to a small tank filled with the solution
under investigation.
Flow velocity is controlled by a peristaltic pump "Ismatec Reglo Digital".
A typical depth is from 35 mm to 50 mm, and
corresponding flow cell volume is from 3.5 mL to 5 mL.
The dead volume
of the flow cell system was approximately 25 mL.
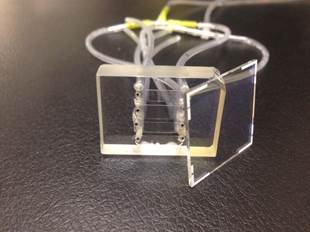
The construction of the 4-channels cell with 4 inlets and 4 outlets presented in Figure 2.
Figure 2: A 4-channels flow cell of the biosensor (with 4 inlet tubes and 4 outlet tubes).
Examples
To verify the sensitivity of the biosensor and to compare it with existing label-free methods, we present the unsmoothed experimental data of free biotin (m=244 Da) binding on the streptavidin monolayer. Initially (see Figure 3), we present the buildup of the streptavidin monolayer on the biotinylated surface. Then the flow cell was rinsed by PBS and biotin was injected into PBS running through the flow cell (see Figure 4).
Streptavidin monolayer deposition
Streptavidin
(diluted in PBS to a concentration of cstr=12 mg/mL)
was run through the flow cell with a volumetric flow rate of vstr=0.3 mL/min.
Figure 3: Immobilization of streptavidin on a biotinylated surface
(top)
and corresponding changes of RI of the buffer during this injection (bottom).
The measurement time was
1 s per point (no posterior data averaging and smoothing).
In the color inset a corresponding process is illustrated.
Figure 4: Adlayer thickness change during free biotin (m=244 Da) binding to the streptavidin monolayer (top) and corresponding changes of RI of the buffer during this injection (bottom).
The measurement time was 1 s per point (no posterior data averaging and smoothing).
In the color inset a corresponding process is illustrated.
Figure 3 illustrates that the increase of the adlayer thickness due to
immobilization of streptavidin on a biotinylated surface (top) occurs with
kinetics different from those of the RI change of buffer during injection
(bottom).
This fact indicates that the volume and surface
contributions from
an analyte are indeed separated into different registration channels.
Biotin binding to the streptavidin monolayer
The top side of
Figure 4 presents the
adlayer thickness changes observed during free biotin binding to the
streptavidin monolayer and the RI changes of the analyte (bottom)
during this biotin solution injection.
Biotin (in a concentration of cb(low)=0.9 mg/mL) was injected
into PBS
running through the flow cell with volumetric flow rate of vb=0.4 mL/min.
It is clear that the biosensor reliably detects the increase in
streptavidin monolayer
thickness upon free biotin binding.
Figure 5: Typical signal obtained by the PC SM optical sensor upon binding of the ligand (40 mg/ml Rabbit IgG) and the analyte (15 mg/ml anti-Rabbit IgG ).
The applicability of the PC SM optical sensor to characterizing ligand - receptor interactions is demonstrated by measuring association and dissociation kinetics of well-studied systems of immunoglobulin G (IgG) proteins: rabbit and mouse IgG (ligands) and goat anti-rabbit and anti-mouse IgG proteins (receptors). The PC SM substrates were modified to get a biological recognition interface for IgG protein binding.
In Figure 5 a typical sensogram registered in situ by the PC SM optical sensor during ligand immobilization and further kinetic assay is shown.
The changes in adsorbed layer thickness (upper panel) and bulk RI of the medium (bottom panel) are determined simultaneously during the experiment.
In the first step, the free carboxyl groups on the surface were chemically activated using EDC / NHS mixture.
Then the ligand (Rabbit IgG) is immobilized following by ethanolamine deactivation of the remaining activated carboxyl groups and detachment of not covalently bound proteins.
Finally a receptor binding to the surface modified with a ligand is observed following by IgG complex dissociation in PBS buffer and regeneration procedure.
Data handling
Data from the CMOS matrix was acquired,
processed and presented using software supplied with the device.
Changes of the critical angle position DP0 and the resonance peak positions DP1
on the CMOS matrix were converted to
changes of the angle parameters DqTIR and DqSM, respectively.
The RI of the liquid was derived as
in that for classical critical-angle Abbe refractometers, through the angle of
total internal reflection qTIR.
The liquid RI is then given by
ne=n0sin(qTIR) ,
where n0 is the RI of the prism in which the critical angle qTIR
is measured.
To derive the changes of the adlayer thickness
from the changes of the resonance angle DqSM and Dne (known from (1)),
we used the dispersion relation for optical surface waves.
Conclusions
The optical surface waves excited on the 1D PC interface is an effective means
to guide and concentrate optical waves in the field of interaction between light and sensing material at the external side of the 1D PC.
The exploitation of the 1D PCs as substrates supporting the long-range surface wave propagation permits researchers to:
(1) increase the sensitivity of PC SM biosensors to the level da ~ 7×10-14m/Hz1/2 (that corresponds to mass sensitivity ma ~ 70 fg/mm2),
(2) segregate surface and volume events in biosensing (that may be an important advantage in applications where temperature and composition of the liquid under study vary over a wide range), (3) enhance the detection of RI variation in the Abbe-like refractometer to the level ne ~ 5×10⁻⁸RIU/Hz1/2,
(4) work with thick target ligands, such as living cells, with thickness up to 1mm
(5) obtain
one-dimensional spatial selectivity that makes multichannel registration possible and
increases throughput of the sensor,
(6) use the same PC chip many times, since a thick final SiO2 layer may be effectively cleaned by some active treatment (e.g., in a plasma cleaner).
Konopsky V.N.,
Alieva E.V.
A biosensor based on photonic crystal surface waves with an independent
registration of the liquid refractive index. //
Biosensors and Bioelectronics,
2010, V.25, P.1212-1216.