Figure 1: A sketch of the imaging biosensor "EVA 3.0" based on wavelength interrogation of a PC SM resonance peak. Typical spectra of the light as it passes from the LED to the color camera are shown.
Photonic Crystal Surface Mode (PC SM)-based biosensor "EVA 3.0" is label-free imaging biosensor with
with a two-dimensional (2D) visualization.
Figure 1 shows a sketch of the biosensor and typical spectra of an optical beam as it passes through the optical elements of the biosensor.
A parallel light beam, with polarization +450 to the plane of incidence, illuminates a one-dimensional (1D) PC chip through a prism (Kretschmann-like configuration).
After reflection, the light beam passes through the second polarizer, which is -450 to the plane of incidence, and is then recorded by a color camera.
Thus, the light beam passes through crossed polarizers and, if the PC SM does not undergo excitation, there is no signal at the color camera.
However, we designed the 1D PC chip so that it supports a p - polarized PC SM at λ = 500 nm with an effective refractive index (RI) ρ= 1.3825, which corresponds to an in-prism excitation angle θ = 65.180.
A fiber-coupled LED, with a peak wavelength near λ = 500 nm is used for excitation of the PC SM.
This excitation causes a phase shift of the surface wave that re-radiates back to the prism.
Therefore, rotation of the resulting polarization of the reflected beam occurs, and, as the result, the light at the excitation wavelength passes through the crossed polarizers.
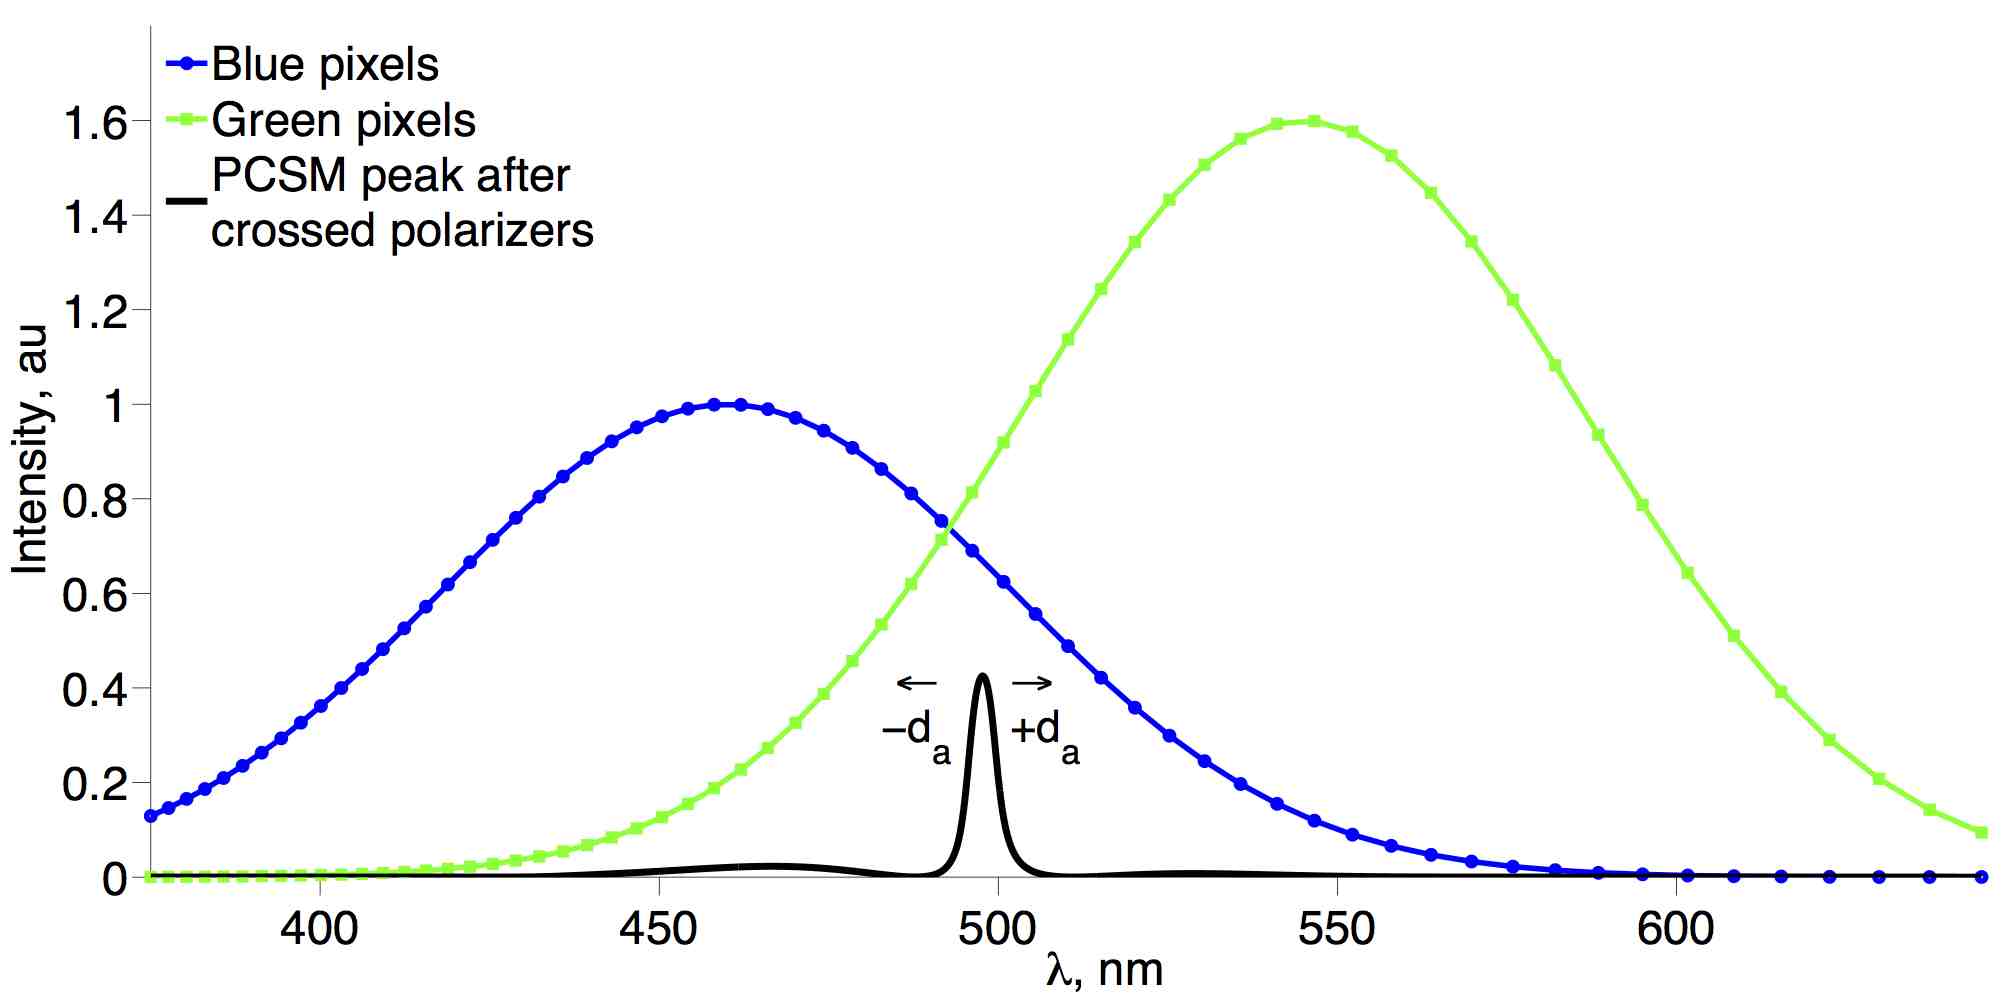
The mean wavelength of the light that has passed through is determined by balancing of the intensities of the blue and green pixels at each point in the color camera.
The structure of the 1D PC was designed so that the excitation wavelength of the PC SM is located between the maxima of the blue and green pixels.
These spectral positions are illustrated schematically in Figure 2.
The figure shows that an increase (decrease) in the adsorption layer thickness da will cause a shift in the PC SM peak (see Figure 2) to longer (shorter) wavelengths, therefore increasing (decreasing) the green component and simultaneously decreasing (increasing) the blue component in the color pixel response.
Figure 2: The spectrum of the PC SM peak is located between the maxima of the blue and green pixels responsivities.
Spectral responsivities of green and blue pixels for a typical color camera are schematically presented using corresponding colors.
Examples
To verify the sensitivity of the biosensor and to compare it with existing SPRi, we present the experimental data of
of changes in volume RI during EtOH injection into a flow cell and the experimental data of
of changes in thickness during deposition of PAH and PSS polyelectrolytes.
Detection of changes in volume RI
Figure 3: PC SM resonance shifts resulting from changes in volume RI.
For an initial test of the biosensor, 4% and 12% EtOH solutions were injected into a flow cell, alternating with pure water injections.
Figure 3 presents the signals from the wavelength shifts (Δλ).
Deposition of PAH and PSS polyelectrolytes
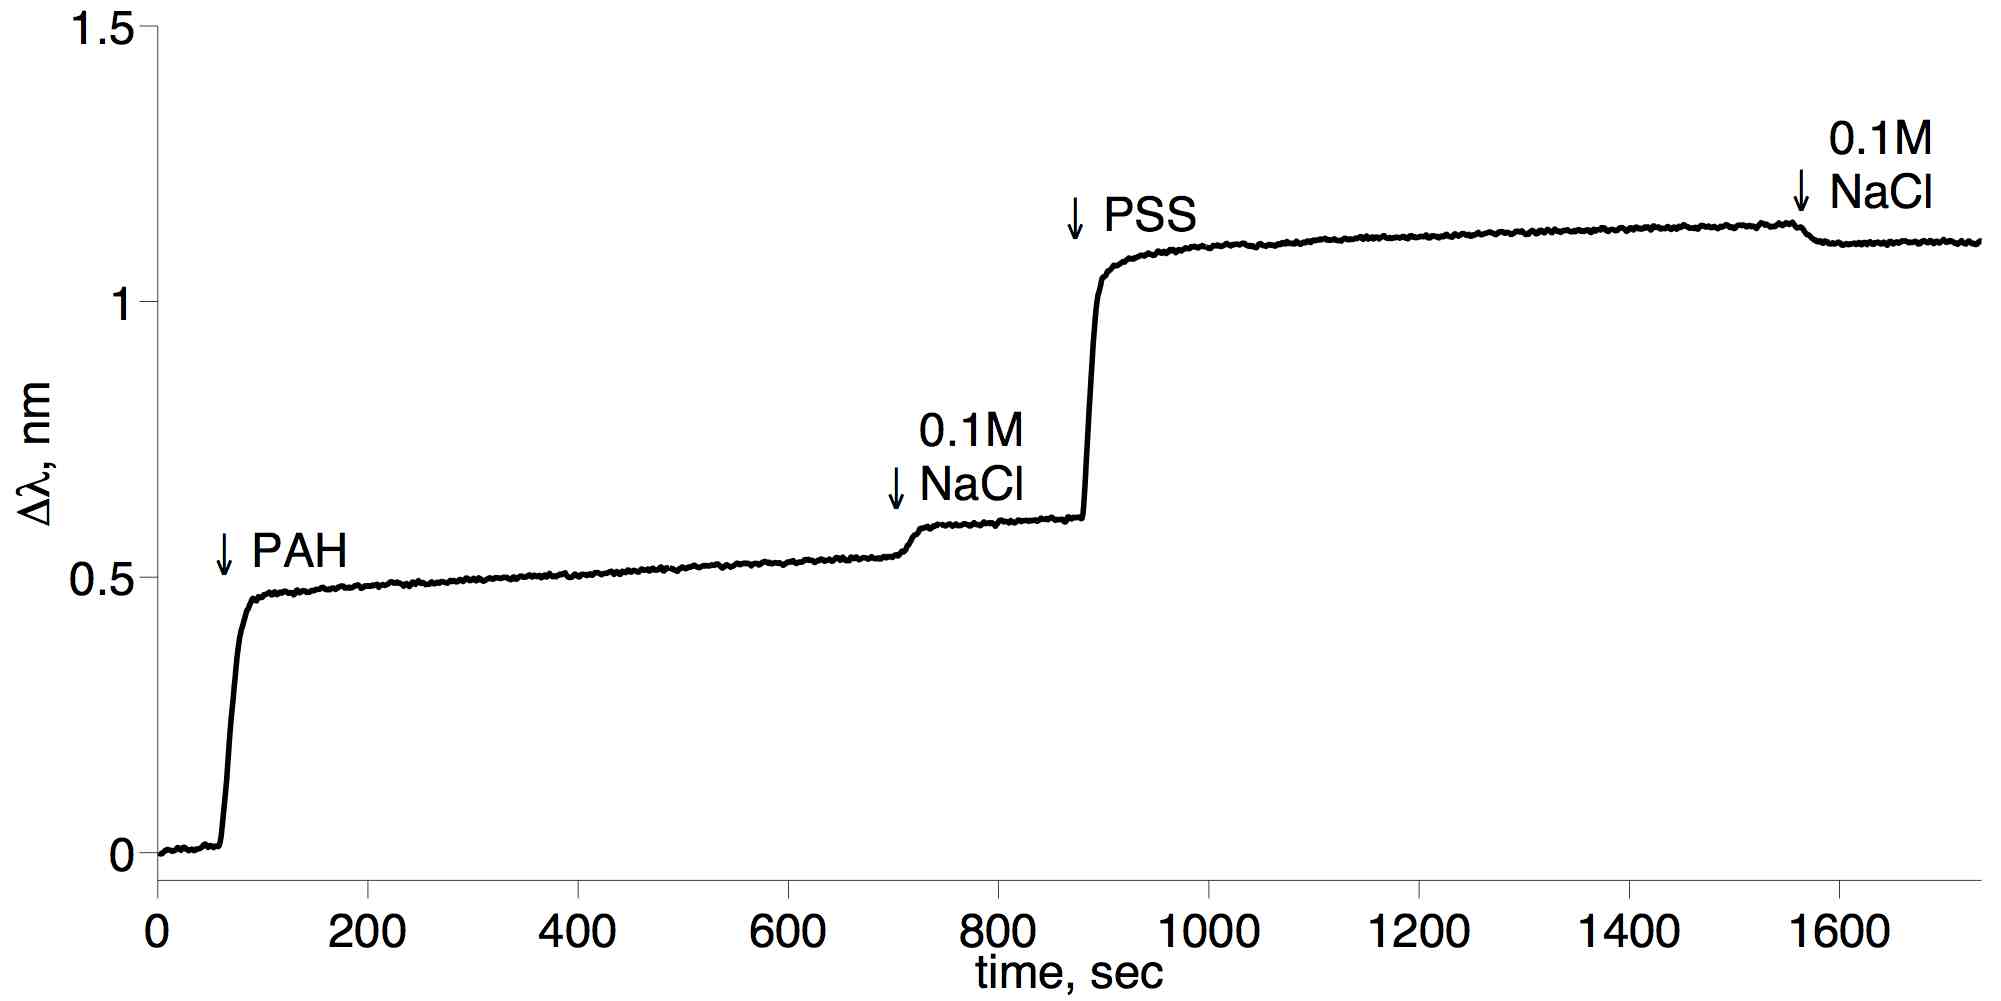
Figure 4: PC SM resonance shifts due to deposition of polyelectrolytes on the surface of the biosensor.
The
Figure 4 presents the
adlayer thickness changes observed during deposition of
a polyelectrolyte sandwich, which was prepared using the positive polyelectrolyte PAH and the negative polyelectrolyte PSS, both at 1 mM concentration (calculated with respect to the monomer) in an aqueous solution of 0.1 M NaCl.
References
[1]
Konopsky V.N.,
Method for registration of processes of deposition on a solid surface with two-dimensional visualization and device for its implementation. //
Russian patent RU 2 661 454 , effective date for property rights and date of filing: 20.07.2017; date of publication: 16.07.2018, Bull.N20.
[2]
Konopsky V.N.,
Alieva E.V.
Photonic crystal surface mode imaging biosensor based on wavelength interrogation of resonance peak. //
Sensors and Actuators B: Chemical,
2018, V.276, P.271-278.